This site uses cookies to improve your experience. To help us insure we adhere to various privacy regulations, please select your country/region of residence. If you do not select a country, we will assume you are from the United States. Select your Cookie Settings or view our Privacy Policy and Terms of Use.
Cookie Settings
Cookies and similar technologies are used on this website for proper function of the website, for tracking performance analytics and for marketing purposes. We and some of our third-party providers may use cookie data for various purposes. Please review the cookie settings below and choose your preference.
Used for the proper function of the website
Used for monitoring website traffic and interactions
Cookie Settings
Cookies and similar technologies are used on this website for proper function of the website, for tracking performance analytics and for marketing purposes. We and some of our third-party providers may use cookie data for various purposes. Please review the cookie settings below and choose your preference.
Strictly Necessary: Used for the proper function of the website
Performance/Analytics: Used for monitoring website traffic and interactions
Businesses, researchers, and those handling large amounts of data depend on data visualization as a crucial tool. It strives to showcase complex data in an understandable visual representation. With technological advancements, data visualization has surpassed traditional 2D graphs and charts.
Picture This: The Rise of Visual Intelligence ccapoccia Fri, 03/01/2024 - 16:42 For decades, leaders across all industries have used photos to see, understand and act upon insights appropriately. Yet the information within an image isn’t always so evident.
Augmented reality in construction represents a revolutionary advancement in project management by overlaying digital building information directly onto physical job sites through sophisticated visualization technology.
Data visualization tools play a pivotal role in this transformation by enabling construction professionals to interpret complex data sets through intuitive charts and graphs. As construction projects become more complex and data-driven , the demand for effective data visualization tools continues to rise.
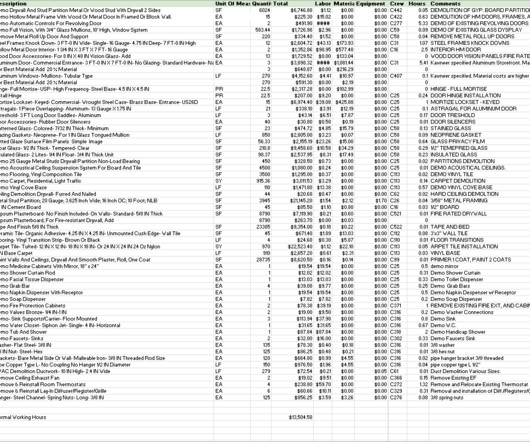
In this regard standardization is an important component to enabling improved information use and sharing. Current, LOCAL MARKET, labor, material, and equipment costs to detail line-item construction tasks provide the highest possible level of cost visualization.
Visualize, understand, and optimize your facilities management repair, renovation, and new build requirements. Visualize, understand, and optimize your facilities management repair, renovation, and new build requirements. Visualize, understand, and optimize your facilities management repair, renovation, and new build requirements.
To ensure success in any project, you need the ability to anticipate changes and make informed decisions. Communicate data in a way everyone can understand Complex data insights are made easily digestible through clear visualizations in an intuitive interface. Staying ahead of cost trends is no longer a luxury, it’s a necessity.
Read the Importance of Online Reviews For Construction Brands for more information. We Will Get Visual. As attention spans decrease, and the oversaturation of information continues, visual (and micro) content will become even more important. Visual content will dominate in 2014. We Will Optimize For Mobile.
Here are a few ideas to convert your next presentation from drab to interactive: Make Your InformationVisually Appealing. Hyperlinking Slide content to construction documents or real-time data collection that translates these field updates into easily understood moving visuals are recommended.
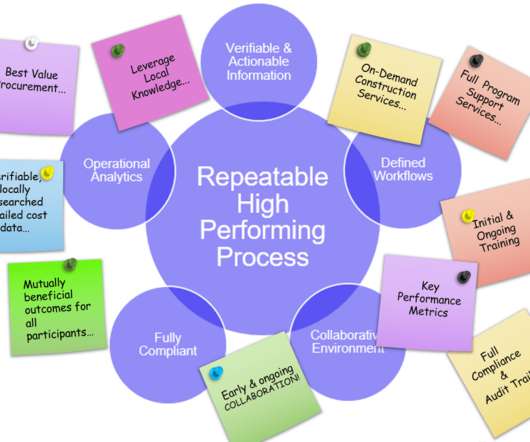
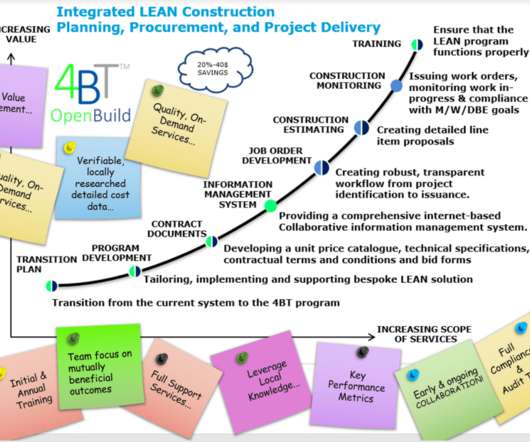
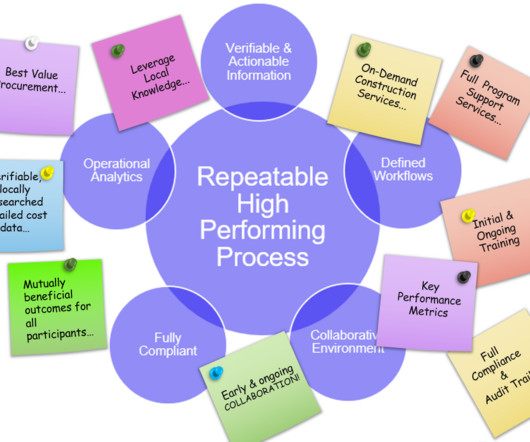
Continuously improve the process by sharing information on an early and ongoing basis. Focus is placed upon people, and processes that support transparent information sharing from planning through project execution and beyond. Needs and deliverables are fully visualized and issues address earlier in the process.
Read the Importance of Online Reviews For Construction Brands for more information. We Will Get Visual. As attention spans decrease, and the oversaturation of information continues, visual (and micro) content will become even more important. Visual content will dominate in 2014. Infographics, videos, pictures.
See the results of Foundation Software's second annual survey by downloading a free copy of the 2020 Construction Business Report, complete with over 25 pages of fully visualized data and insights from industry leaders. How will we use this information? For more information, please visit our Privacy Policy. Main Image.
Utilizing computer vision, AI technology for visual jobsite tasks 0 qpurcell Mon, 05/01/2023 - 09:32 AEC Tech Burns & McDonnell breaks down three ways computer vision can effectively assist workers on the job site, from project progress to safety measures. This technological solution is called computer vision.
As mentioned in a previous blog post on market research , there are several options for gathering information about customers and their buying preferences and purchase intentions. But what are some of the strategic tools that can be employed to assist in marketing decision-making? Perceptual Maps.
VDC managers and other building information modeling (BIM) experts can align and execute on design intent and constructability — with model reviews and markups, automatic clash detection, integrated issue management, and design change analysis. Autodesk Takeoff makes it easy to visualize project scope with aggregated 2D and 3D takeoffs.
The reasons most often cited for dated information are lack of access to this data at the right time, query driven reporting and a reliance on accounting/finance for information. Having access to real-time information is critical to a construction project’s success. Visualized Data for Faster Decision Making.
One technology in particular—building information modeling (BIM)—is leading the way. Using a 3D model to visualize what’s happening on the project provides the most value, as it’s much easier to digest for non-specialists. BIM is an intelligent, 3D model-based process that helps general contractors become more accurate and efficient.
Modern contractors have the technology tools at their disposal to bring everyone involved in a project together to see relevant data in real-time, provide simple ways to update information for everyone at once and automate communication and workflows. Keep it Simple (and Visual).
Visualize, understand, and optimize your facilities management repair, renovation, and new build requirements. Visualize, understand, and optimize your facilities management repair, renovation, and new build requirements. Visualize, understand, and optimize your facilities management repair, renovation, and new build requirements.
Another problem with paper forms is that works sometimes write the same information repeatedly, using expensive carbon copies. An app can collect the same information in a fraction of the time that paper requires. An app can collect the same information in a fraction of the time that paper requires.
The innovate and exclusive Collaborative LEAN Construction Software for the Enterprise or Single Organization offering all of these features. The innovate and exclusive Collaborative LEAN Construction Software for the Enterprise or Single Organization offering all of these features.
Understanding Content Marketing in Construction Content marketing in construction is about creating and sharing valuable information that attracts and engages potential clients. Effective content marketing strategies help construction companies build strong relationships with their audience by delivering consistent and relevant information.
Change how you create, share, & reuse information. Take BIM for example, or more specifically the “M” For the most part the “M for Modeling” and 3D visualization has been the sole focus and driver as opposed to the “M” for management. Change your relationships. Change your outcomes. The latter has been neglected.
Building Information Modeling (BIM) isn’t a new concept in construction. Streamlined handover —BIM improves access to information (such as warranties, serial numbers, and audit histories) after handover. Because so many of these benefits relate to improved efficiency, BIM tends to have a strong impact on ROI. in 2016 to 10.4
This book contained groundbreaking information on the best tactics for construction marketers looking to improve brand engagement and exceed new business goals. A while back, the Construction Marketing Association released an industry leading book, Tools of the Trade: Modern Marketing for Construction Brands.
Utilizing Building Radar’s analytics provides data-driven insights that highlight specific training needs and inform the development of customized training materials. Visual content helps in breaking down complex information and caters to different learning styles, ensuring that all team members can grasp the essential concepts.
BIM (Building Information Modeling) is the efficient management of the life-cycle of the built environment supported by digital technology. It’s important to not that “3D” or “3D visualization” is not include in this core definition of BIM.
Progress — Data visualizations communicate urgency to direct team members to help keep projects on schedule. Team’s user-friendly dashboard with filter, sort and drill-down capabilities makes it easy to find and interpret information as well. Operations dashboards — Curated action items are sortable and filterable.
Many, if not real property owners, and all real property owner in the federal public sector, simply don’t have the right tools, processes, and information in place to efficiently manage the assets. For example, fundamental baseline tools and information include… 1. KNOWLEDGE MANAGEMENT AND TECHNOLOGY.
Cladding offers a harmonious blend of both visual appeal and performance. Ensure residents are informed well in advance to make necessary arrangements, minimizing inconvenience. In construction, a building’s exterior serves more than just an aesthetic purpose; it’s also about functionality.
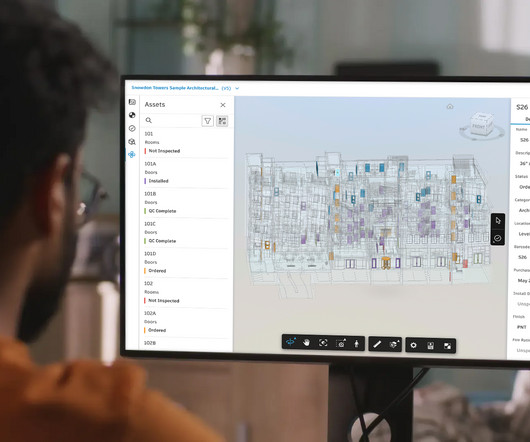
Today’s teams have made great strides at creating rich BIM models that enable users to visualize a project in greater detail. This capability lets teams visualize color-coded asset statuses directly from the 3D model viewer. Filter views Drill down to see only the necessary information or visually report on custom fields.
For more information, link here. Computerized maintenance management system (CMMS), might also be called computerized maintenance management information system (CMMIS), is a software system that maintains an information database about a facilities maintenance operations. Visual Lease. Hippo CMMS. Dude Solutions.
They’re helping designers who need to survey an area and visualize structures, since images from drones can help with the creation of building information models (BIM). Augmented reality is enabling field measurements and visualization of models. More and more contractors are using drone technology.
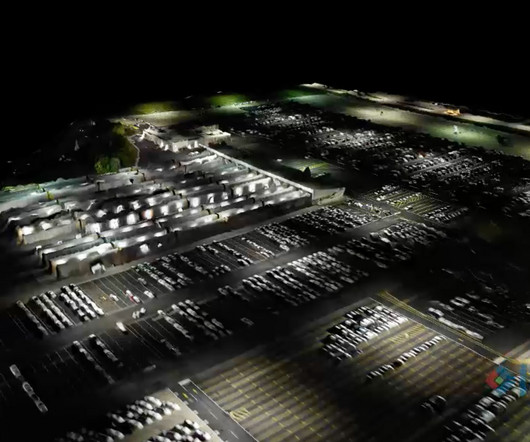
discusses strategies for using visualization and reality capture. While photos and drawings can offer a small glimpse of an overall site, it can be challenging to visualize and understand how all elements relate to one another. Our presentation, “ Enhanced Visualization & Reality Capture from a Bird’s Eye View ” will be at 4 p.m.
Sharing information about the event, your business and what you hope to gain can do wonders for your business. LinkedIn Events lets you connect with others who will be there and you’ll be able to get a visual of people you want to meet. Before the Event. Brand and business marketing before the tradeshow or event is a must.
Modern, integrated construction technologies are helping contractors realize real-time, automated data collection — and pairing that data with powerful tools to easily analyze the underlying stories the information tells. This means users don’t have to reenter information a second time. Tying Data to Real-World Locations – And Actions.
Long before purchase and immediately before purchase, consumers are seeking information. Provide them the information and they’ll keep you in mind when their ready to purchase. Good thought leadership brings consumers to you when they are searching for information. This easily fits with the construction industry. Social Media.
To check how good the slip-on connection is, a simple visual examination, a magnetic particle, or a PT test are the approaches you can follow. If, however, the connection is critical and visual examination alone won’t be enough, you can carry out liquid penetrant or magnetic particle tests to check the strength of the connection.
Understanding the differences between products, such as the variations in vinyl types or the protective qualities of different laminates, can help specifiers make informed decisions that align with the projects goals and budget. These proactive design measures deter vandals and enhance the visual appeal of commercial properties.
To find out which masks are most effective at containing droplets, researchers at Florida Atlantic University used flow visualization to compare four common masks, according to Construction Dive. CORONAVIRUS: RESOURCES AND INFORMATION. Most Effective Face Coverings for Protecting Jobsites. cbroderick. Mon, 07/13/2020 - 09:18.
Connecting technologies and information is crucial for construction firms to transition from data novices to data leaders. Now, project managers can visualize 3D models generated in Metaroom directly into Autodesk Build Insights or BIM 360 Project Home dashboards.
To help our clients that deal with PSM, we would draw your attention to the top 5 most cited standards from PSM NEP : Mechanical Integrity Process safety information PHA Operating procedures Management of change. Unfortunately, there are no clear-cut answers.
Dozens of phone calls to track down simple information. Information overload can drown you in numbers, but if you talk to the right people, ask the right questions, and learn from your current pain points, you will set your organization up for success. Ownership of key information at every stage of the project. Paper timecards.
We organize all of the trending information in your field so you don't have to. Join 116,000+ users and stay up to date on the latest articles your peers are reading.
You know about us, now we want to get to know you!
Let's personalize your content
Let's get even more personalized
We recognize your account from another site in our network, please click 'Send Email' below to continue with verifying your account and setting a password.


Let's personalize your content