This site uses cookies to improve your experience. To help us insure we adhere to various privacy regulations, please select your country/region of residence. If you do not select a country, we will assume you are from the United States. Select your Cookie Settings or view our Privacy Policy and Terms of Use.
Cookie Settings
Cookies and similar technologies are used on this website for proper function of the website, for tracking performance analytics and for marketing purposes. We and some of our third-party providers may use cookie data for various purposes. Please review the cookie settings below and choose your preference.
Used for the proper function of the website
Used for monitoring website traffic and interactions
Cookie Settings
Cookies and similar technologies are used on this website for proper function of the website, for tracking performance analytics and for marketing purposes. We and some of our third-party providers may use cookie data for various purposes. Please review the cookie settings below and choose your preference.
Strictly Necessary: Used for the proper function of the website
Performance/Analytics: Used for monitoring website traffic and interactions
Injury Prevention Programs Reshape Old Safety Perspectives. Even with every government-mandated safety precaution in place, companies across the country struggle to protect their employees from preventable workplace injuries. Alex Headley. Fri, 10/29/2021 - 15:44.
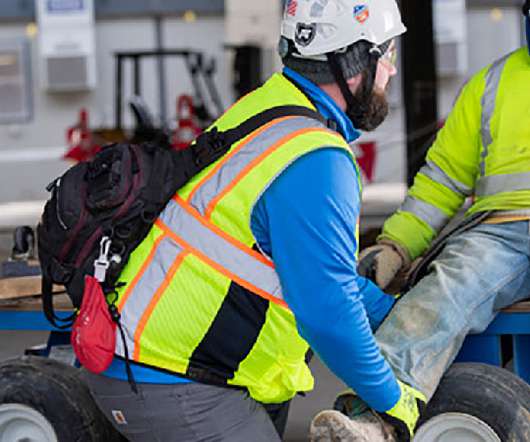
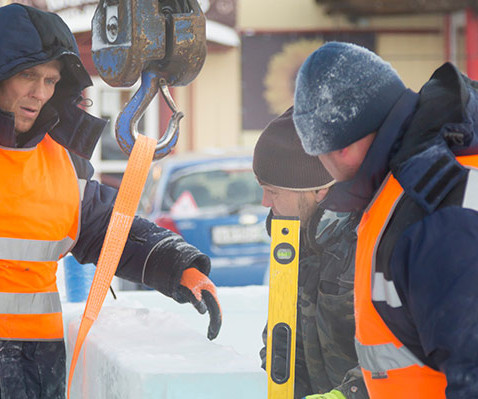
Keep Your Hands Safe in the Workplace This Winter ccapoccia Thu, 01/04/2024 - 12:11 Hand injuries accounted for 102,350 days away from work in 2020, according to the Bureau of Labor Statistics and the National Safety Council. The winter months only increase the risk of hand injury in the construction industry.
Learn how to put together a comprehensive Drops Prevention Program that will be easy to roll out on any project, fit the hand tools used daily, and engage your professionals in safe working habits—all while reducing injury/death and meeting the new ANSI/ISEA 121-2018 standard. In this webinar, we’ll cover: Drops statistics.
WASHINGTON (October 2, 2012) – Preliminary results from the Bureau of Labor Statistics' National Census of Fatal Occupational Injuries were released today. Findings show that the number of fatal work injuries in 2011 was slightly lower than final results from 2010. Secretary of Labor Hilda L.
According to the Bureau of Labor Statistics, there are more than 50,000 "struck by falling object" OSHA recordables every year in the United States. That is one injury caused by a dropped object every 10 minutes. But how many dropped object accidents go unrecorded?
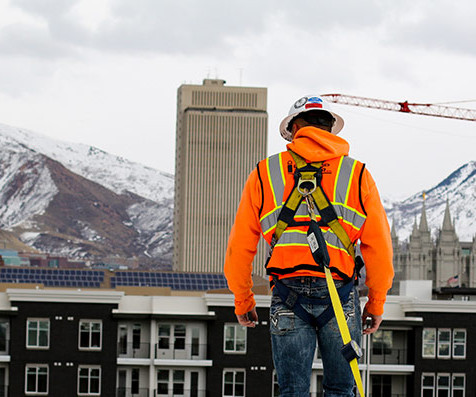
Effective Fall Protection Methods for Dynamic Jobsites ccapoccia Tue, 10/15/2024 - 21:38 Every year, the same hazard reigns supreme as the leading cause of injuries and fatalities in the construction industry: falls from heights.
According to a 2016 Bureau of Labor and Statistics (BLS) report, construction led all other industries in fatal work injuries at 991—a rate of 10.1 Construction remains one of the most dangerous industries to work in. per 100,000 full-time equivalent workers.
This statistic doesn't include the amount of injuries that are seen in the field every year, which are regularly numerous and often perilous. Out of all of the private sector fatalities in 2014, one in five occurred in the construction industry.
Annual statistics released by the Health and Safety Executive (HSE) confirm that there were 51 fatal injuries to construction workers in the year to March 2024. To read more of this and every other news story on this site, please log in with your Construction Law membership account details.
Whilst the UK construction industry continues to see growth month on month, it still remains a potentially dangerous industry to be a part of, with the risk of injury apparent every day. In 2012/13, there were 39 fatal injuries to workers within the construction industry. Major Injuries. Over Seven Day Injuries.
Bureau of Labor Statistics, 2.8 million nonfatal injuries or illnesses occurred in private industry workplaces… The American Society of Safety Professionals (ASSP) responded to 2018 safety numbers by calling for private employers to look more closely at their safety practices. According to the U.S.
OSHA’s proposal to publish online the workplace injury and illness reports from companies with more than 250 workers may at first blush sound like a good idea in this age of transparency, but there are some good reasons not to do this. The logs contain statistical data on injuries and illnesses, but provide no insight as to the cause.
The construction industry is notably high-risk; according to the Bureau of Labor Statistics, construction has the second-highest occupational fatality rate. The Travelers 2022 Injury Impact Report found that injured construction workers spend an average of 98 days away from work.
he recent preliminary Census of Fatal Occupational Injuries, conducted by the U.S. Bureau of Labor Statistics, revealed that in 2013, the number of fatal work injuries in the private construction sector stayed about the same as the year prior.
A preliminary total of 4,405 fatal work injuries were recorded in the U.S. in 2013, lower than the revised count of 4,628 fatal work injuries in 2012, according to results from the Census of Fatal Occupational Injuries (CFOI) conducted by the U.S. Bureau of Labor Statistics.'
But there is no authoritative nationwide repository of bird casualties or injuries, so estimating the scope of this is difficult. The County Department of Inspections, Licenses and Permits statistics indicate it would apply to less than 1% of permits issued each year.
Recordable injuries and illnesses in the construction industry fell for the third straight year in 2017. According to a report by EHS Today, the industry reported 198,000 incidents, according to data from the Department of Labor’s Bureau of Labor Statistics (BLS). The BLS numbers also show that the…
According to the Bureau of Labor Statistics, there are more than 50,000 "struck by falling object" OSHA recordables every year in the United States. That is one injury caused by a dropped object every 10 minutes. But how many dropped object accidents go unrecorded?
Bureau of Labor Statistics reports. The total of 4,836 fatal work injuries in 2015 was up slightly from the 4,821 reported in 2014. In 2008, the number was 5,214, the bureau’s Census of Fatal Occupational Injuries said.
Defective equipment will lead to serious injuries or fatalities, apart from causing system, structural and electrical failures. You don’t want to provide an unsafe working environment and you definitely wouldn’t want to be held liable for any employee injuries caused by faulty equipment. – Improved Employee Morale.
This statistic doesn't include the amount of injuries that are seen in the field every year, which are regularly numerous and often perilous. Out of all of the private sector fatalities in 2014, one in five occurred in the construction industry.
Deadly workplace injuries for women dominated by transportation, violence. Department of Labor released its 2011 Census of Fatal Occupational Injuries recently, and while workplace deaths were down, the data presents some interesting reminders about workplace safety and workplace violence especially as related to gender and family.
While a good and helpful idea, OSHA recordable and lost work-day case rates may be too much of a focus for many companies, while off the job injuries often go unaddressed. The same is true for off-the-job injuries, which ultimately cost employers millions of dollars each year. These injuries occurred off the job.
While a good and helpful idea, OSHA recordable and lost work-day case rates may be too much of a focus for many companies, while off the job injuries often go unaddressed. The same is true for off-the-job injuries, which ultimately cost employers millions of dollars each year. These injuries occurred off the job.
Although Bureau of Labor Statistics (BLS) statistics show a decrease in on-the-job fatalities, transportation remains the most dangerous vocation. Total fatal on-the-job injuries fell to 5,190 in 2016 from 6,217 in 1992, a 16.5-percent percent decrease, according to BLS. These findings were published in…
These studies include terrifying statistics on accidents, injuries, deaths, age groups most likely to be hurt, and suggestions on how to drive safer. April is National Distracted Driving Awareness Month meaning organizations such as OSHA, M.A.A.D, and EndDD are releasing annual studies on distracted driving.
Statistics show that there are over 400 injuries and over 20 fatalities each year related to construction in Ontario alone. A majority of construction-related injuries occur due to a lack of proper personal protective equipment (PPE), such as helmets and gloves. Providing adequate safety gear.
Bureau of Labor Statistics Releases Finalized Occupational Death Findings. The Bureau of Labor Statistics released the finalized occupational death counts for 2011 late last week. The number represents the third lowest annual total since the fatal injury census was first conducted in 1992. in 2011 was 3.5 reported for 2010.
Bureau of Labor Statistics reported. Fatal falls were up 9% in 2014, according to preliminary estimates from the Census of Fatal Occupational Injuries conducted by the Bureau. Of those incidents, the large majority resulted from falls to a lower level, and where the height of the fall was known, two-thirds were 20 feet or less.
The Occupational Safety and Health Administration has issued a final rule requiring all federal agencies to annually submit injury and illness data to the Bureau of Labor Statistics. The rule will clarify the definition of federal establishment and explain when contract employees should be included on an agency’s log.
Each year, the Research Institute produces the Liberty Mutual Workplace Safety Index , which ranks the leading causes of serious, nonfatal work-related injuries in terms of direct workers compensation costs. Bureau of Labor Statistics (BLS) and the National Academy of Social Insurance.
Bureau of Labor Statistics Safety Data. Total rate (Case rate for days away Since 1992, US businesses, governmental agencies, and industry have substantially reduced the number of recordable injuries. Rate Change Over Time Period. Percent Change. TRIR (Total Record Incident Rate). 63% decrease. 58% decrease.
The Occupational Safety and Health Administration has issued a final rule requiring all federal agencies to annually submit injury and illness data to the Bureau of Labor Statistics. The rule will clarify the definition of federal establishment and explain when contract employees should be included on an agency’s log.
OSHA reminds employers to post injury and illness summaries. Employers that are required to record work-related injuries and illnesses and haven’t posted their summary of those records yet could be cited by the Occupational Safety and Health Administration for failing to meet their responsibilities as an employer.
On August 1, 2017, the Occupational Safety and Health Administration (OSHA) launched its Injury Tracking Application (ITA), which allows employers to begin observing compliance with this year’s new electronic reporting requirements. Through the ITA, employers can submit necessary injury and illness records from their 2016 OSHA Form 300A.
Fatal work injuries in the U.S. rose 7% to a preliminary total of 5,190 in 2016, according to the Bureau of Labor Statistics. Deadly injuries among construction trades workers increased 6%, or a total of 991 fatalities, in 2016. The fatal injury rate for roofing workers increased from 39.7% were construction fatalities.
A fact sheet recently released by the Parkland Institute, a non-partisan public policy re search institute in the Faculty of Arts at the University of Alberta, states that the Alberta Government is understating the numbers of workplace injuries that occur each year.
That is a statistic that “ The Construction Industry Helpline ”, an organization to help those in the construction industry on a variety of topics, CEO Bill Hill has discovered. Construction has one of the highest risks of suicide amongst its employees but they aren’t taking the statistics lying down, they are starting to fight back.
The latest edition of the annual Injury Facts book published by the National Safety Council is out, and while company CEOs and safety directors might not take the time to read all 210 pages, there is one set of statistics worth special attention. CEO, FDRsafety. By Fred Rine. About half occur in the home.
Each year, the Research Institute produces the Liberty Mutual Workplace Safety Index , which ranks the leading causes of serious, nonfatal work-related injuries in terms of direct workers compensation costs. Bureau of Labor Statistics (BLS) and the National Academy of Social Insurance.
The Occupational Safety and Health Administration today issued a proposed rule to improve workplace safety and health through improved tracking of workplace injuries and illnesses. “Three million injuries are three million too many,” said Assistant Secretary of Labor for Occupational Safety and Health Dr. .
. -- A new study shows construction firms that hire union workers have fewer work injuries requiring workers’ compensation payments for time away from work.
OSHA reminds employers to post injury and illness summaries. Employers who haven’t posted their injury/illness summaries could be cited by the Occupational Safety and Health Administration for failing to meet their responsibilities as an employer. information about the number and type of reportable safety incidents, and.
We organize all of the trending information in your field so you don't have to. Join 116,000+ users and stay up to date on the latest articles your peers are reading.
You know about us, now we want to get to know you!
Let's personalize your content
Let's get even more personalized
We recognize your account from another site in our network, please click 'Send Email' below to continue with verifying your account and setting a password.


Let's personalize your content