This site uses cookies to improve your experience. To help us insure we adhere to various privacy regulations, please select your country/region of residence. If you do not select a country, we will assume you are from the United States. Select your Cookie Settings or view our Privacy Policy and Terms of Use.
Cookie Settings
Cookies and similar technologies are used on this website for proper function of the website, for tracking performance analytics and for marketing purposes. We and some of our third-party providers may use cookie data for various purposes. Please review the cookie settings below and choose your preference.
Used for the proper function of the website
Used for monitoring website traffic and interactions
Cookie Settings
Cookies and similar technologies are used on this website for proper function of the website, for tracking performance analytics and for marketing purposes. We and some of our third-party providers may use cookie data for various purposes. Please review the cookie settings below and choose your preference.
Strictly Necessary: Used for the proper function of the website
Performance/Analytics: Used for monitoring website traffic and interactions
Businesses, researchers, and those handling large amounts of data depend on data visualization as a crucial tool. It strives to showcase complex data in an understandable visual representation. With technological advancements, data visualization has surpassed traditional 2D graphs and charts.
Construction presentation effectiveness is the difference between winning and losing a project. The static slide is being usurped by interactive presentations. Here are a few ideas to convert your next presentation from drab to interactive: Make Your Information Visually Appealing. Update Your Construction Visual Aides.
Data visualization tools play a pivotal role in this transformation by enabling construction professionals to interpret complex data sets through intuitive charts and graphs. As construction projects become more complex and data-driven , the demand for effective data visualization tools continues to rise.
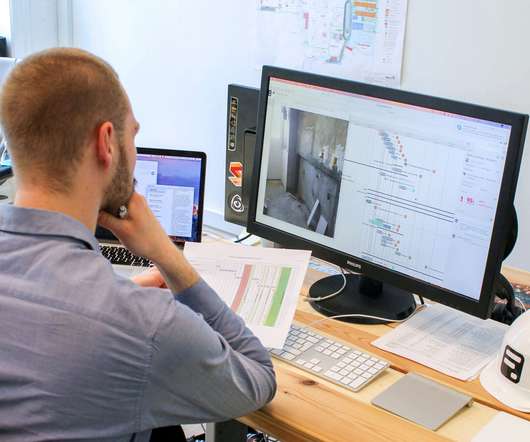
For teams to extract value from data, they must first make sense of the information they have—which is where data visualization comes in. Construction projects involve massive amounts of information and documents, including BIM models, schedules, budgets, and performance reports. Unfortunately, around 95% of that information goes unused.
Visual Branding. Add fonts, colors, and visuals that match your branding. As a host, having your gear mess up mid-presentation is embarrassing. What are their goals? Knowing these three questions will allow you to get a better understanding of the audience. You need to be consistent and align everything with your brand.
How to General Contractors help a project Owner Visualize the Project’s Percentage of Completion? The problem is most owners need visuals. Consider it a early Christmas present as I know all Bluebeamers have been good this year! Bluebeam Revu Bluebeam Revu Tips Custom Status Project Owner Visualizing Project Completion'
How AI can augment the design visualization process 0 qpurcell Wed, 10/16/2024 - 12:43 AEC Tech Blog author Tim Beecken, AIA, uses the design of an airport as a case-study for AI’s potential in design visualizations. In this post, I’ll focus on AI’s role in design visualizations.
Visual Indication Trims Solve Security Challenges in Retrofits 1 kcichowicz Tue, 09/03/2024 - 10:54 Backwards compatible visual indication trims can help retrofits more readily achieve recommendations for safer school design. This is especially true when visual indication trims are backwards compatible to existing locks.
This part covers home improvement retail merchandising and packaging and gives visual examples of both. Merchandising is the visualpresentation of products in the store including all types of displays, signage, and in-store promotions. Stay tuned for Part 3 which discusses retail line reviews. Retail Merchandising.
Second, and most important, the process of writing down and visually organizing your own product’s presentation is your first step toward developing the skill of identifying effective layout and presentation when it’s done by others on your behalf. Presenting the Premium and the Offer.
Great for prequalification presentations, jobsite, and pre-construction meetings! ProInsights.me (Android tablets, iPad and the iPhone) This app offers a better way to visualize your connections with infographics, has an intelligent search that’s useful for finding someone when their name escapes you.
Visual Indication Trims Can Increase Patient Privacy & Medical Safety 1 kcichowicz Tue, 10/01/2024 - 11:28 Visual indication trims display a door’s status and can be specified throughout the built environment to support privacy and medical safety.
discusses strategies for using visualization and reality capture. While photos and drawings can offer a small glimpse of an overall site, it can be challenging to visualize and understand how all elements relate to one another. Our presentation, “ Enhanced Visualization & Reality Capture from a Bird’s Eye View ” will be at 4 p.m.
Google loves LinkedIn and I’ve been including this fact in many powerpoint presentations and national speaking engagements for over a year now. Not sure of it as a valuable application but it is very visual as seen in this screenshot: Next, I had to try out LinkedIn Signals. First, let’s peek at NewIn.
Our newest sponsor, Renoworks – providers of market leading visualization solutions for the building products industry , are hosting the Remodeling Growth Forum. Topic : Improving the Metrics That Matter with Visualization. Expertise : Visualization Pro. Renoworks Pro, is the market leading visualization tool for contractors.
For many builder and remodeling firms a visualpresentation often sells the clients. Determine and present the number of new hires per year and the cost of quick turnovers along with the cost-savings on having engaged, productive employees. Try Video Content. This can be true in recruiting as well. Build a business case.
Visual Aids and Multimedia Using visual aids and multimedia elements like videos, infographics, and animated presentations can make training materials more engaging and easier to understand. Conclusion Designing engaging training materials is essential for empowering construction sales teams to excel in a competitive market.
Kim Byoung-hoon, were present as well. The ingenious solutions presented by the four winners illustrate the power and potential of tech-for-good to spread positive impact on the world. .: developed an assistive information display device for the visually impaired composed of 2,400 braille pins – or ‘dots’ – which move up and down. The
But more often than not, the final selection depends on your ability to win it during the “shortlist presentation.” ” Recently, I asked Erica Olson, author of Speak Simple: The Art of Simplifying Technical Presentations to give us some pointers on improving our shortlist presentations. Can you explain that?
HOK presents neurodiversity research and design guidelines at SXSW 2024 0 qpurcell Thu, 06/06/2024 - 06:44 Office Buildings Workplace experts share insights on designing inclusive spaces that cater to diverse sensory processing needs. You don’t have to be at the ends of the spectrum to be annoyed by sound, temperature or light,” she said.
These visual cues should heighten our awareness so why not place them on your plans to remind employees as they enter work areas what is present? Use Bluebeam to help you with safety talks, acting as a visual aid. Why visuals are so important to safety. They are also easier to recall.
Below we have created a graphic that helps better visualize the construction technology space and how these tools are spread across the various parts of the construction industry. You can check out both spreadsheet of construction software companies and their locations across the globe below.
In construction, every project is different and presents its own set of challenges. Keep it Simple (and Visual). Keep communications simple and visual with dashboards, graphs and key project updates. Providing a consistent level of value to clients through routinely hitting these baseline objectives should be a baseline goal.
Data Center Trends: The Present And The Future appeared first on Business Facilities (BF) Magazine. Archives Articles By Industry Articles By Topic Contributed Columns Data Centers Executive Analysis Featured Post Online Features data centers Solid State Technology Visualization'
has presented a useful construction video that shows how to create the design of a concrete slab with Visual Analysis 9.0, Visual Analysis is a construction program ideal for structural analysis and member design of standard beams, columns, frames, trusses and building models. a powerful software for structural engineers.
Understanding which topics resonate most can help refine future presentations, improving overall effectiveness. When choosing a platform, consider not just the features, but also the ease of use for both presenters and attendees, which can significantly impact the success of your webinar.
If you think your firm could benefit from this sort of viewing and visualization enhancement then Fuzor''s just presented another strong practical reason to check them out,and this is just a first pass, they''ll be looking for feedback to make this a killer feature.
The AIA COTE® Top Ten Toolkit presents curated, concise and effective strategies for achieving sustainable designs and provides criteria for evaluating a project after it is built. Additionally, it can help start a dialogue that facilitates a more deeply integrated, visually rich design solution.
In healthcare, AR is being used to visualize organs or simulate procedures. AR technology can be used in project presentations, for progress capture, for enhanced collaboration, for better safety, and when construction training is needed. Consider the following use cases: Project presentation. VisualLive. What is AR?
Engineering Challenges Constructing the Panama Canal presented numerous challenges, including dense jungles, mountainous terrain, and a high prevalence of diseases like malaria and yellow fever. Enhancing Insight Accessibility and Actionability Building Radars tools not only visualize data but also enhance its accessibility and actionability.
Use Varied Strategies to Present Content. This way, students have auditory and visual input—more than just one mode. Using different mediums to present information and engage students is important in inclusive classrooms. Here are five ways you can start implementing inclusivity into your classroom today: 1.
However, when faced with design constraints such as a giant structural shear wall, limitations in ceiling heights, and the proximity to a busy thoroughfare like the Ventura Freeway, we were presented with a unique challenge when designing the entry experience for Encino Senior Living.
With construction design software, you can visualize different design possibilities, create professional presentations, better assess risks , and make more informed decisions. The software does offer a decent amount of customization along with 3D visualization, sketching, and rendering tools.
Content (balance of written copy and visuals). Bounces – Emails that have been sent back to sender as the recipient email address was invalid or presently not working. Following is a list of email elements you can test before sending out an email: Subject Line. Offer/promotion/Call-to-action. Layout of the email. Headline/Title.
The mechanic lien laws, however, actually made a great subject for such visualized data, and I invite you to take a look at it over on our blog or below. The mechanics lien infographic visualizes the mechanics lien laws, and also presents some data from a survey Zlien conducted of mechanics lien claimants who filed liens in 2011.
After several weeks of work, we are proud to present you the initial phase of LB Aproplan’s visual redesign. But the benefits go beyond just the visuals – the gradual upgrades we are working on will also make the application faster and more reliable.
You can also upload images, creating inarguable date-stamped visual records of condition and status. Being able to present a dossier of information is often vital when negotiating prices with construction firms, renegotiating a tenant’s lease, or arranging ongoing maintenance from a subcontractor.
Visually, it had to echo the more modern Kent State College Architecture and Design building while nodding to the nearby, more classic structures of the central business district. Additionally, the station had to present an energized, neighborly aesthetic positioning it as a safe pillar of the community.
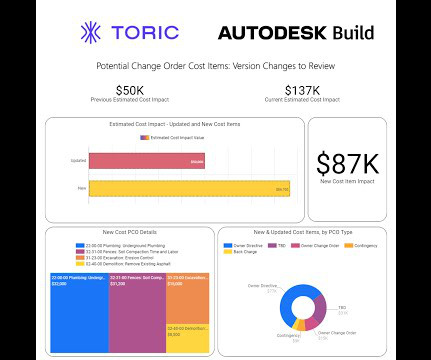
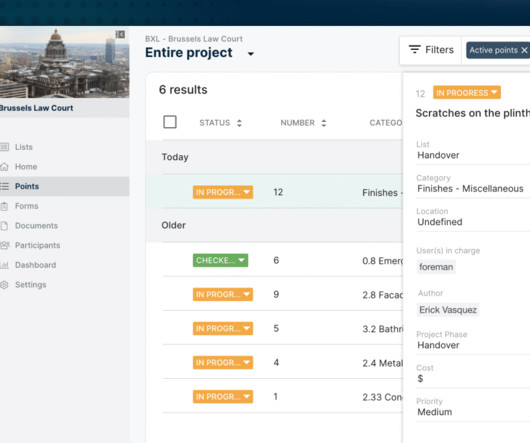
The great advantage of a dashboard is that it presents and compares complex data drawn from several sources using visual tools (i.e., Others rely on an executive dashboard for an overview of data culled from various sources (e.g., their accounting software, CRM tools, and website analytics). tables, line graphs, and bar graphs).
Apps also allow users to take photos to provide additional visual information to back up an inspection. These time cards present challenges however, such as they don’t provide real time data and they can be inaccurate. Automatic date and time stamps can prove when an inspection took place.
A thorough understanding and visualization of a project among Owners, Architects and Engineers, Contractors, and other shareholders defines scope, specifications, and is is the project delivery method that set the overall tone of interrelations ships among the project participants and shapes final outcomes.
They were the slips, trips, fall, strains, struck by a hand tool, etc. and typical of injuries borne out by the OSHA recordable cases where engineering safeguards do not apply.
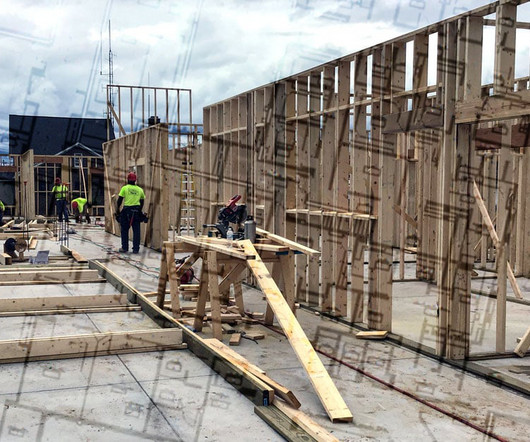
During this phase, clients will also get a construction cost estimate that is sufficient for presenting to an owner’s financial institution for securing a construction loan.
Big Stuff Sketchy lines - yep, create sketchy alteration to views Family parameter order adjustments - reorder/control parameter position Schedules/material takeoffs - Access to Additional parameters and Grand Total customization Revision improvements - Delete Revisions and more sketching options View references - Reassign view reference to different (..)
We organize all of the trending information in your field so you don't have to. Join 116,000+ users and stay up to date on the latest articles your peers are reading.
You know about us, now we want to get to know you!
Let's personalize your content
Let's get even more personalized
We recognize your account from another site in our network, please click 'Send Email' below to continue with verifying your account and setting a password.


Let's personalize your content