This site uses cookies to improve your experience. To help us insure we adhere to various privacy regulations, please select your country/region of residence. If you do not select a country, we will assume you are from the United States. Select your Cookie Settings or view our Privacy Policy and Terms of Use.
Cookie Settings
Cookies and similar technologies are used on this website for proper function of the website, for tracking performance analytics and for marketing purposes. We and some of our third-party providers may use cookie data for various purposes. Please review the cookie settings below and choose your preference.
Used for the proper function of the website
Used for monitoring website traffic and interactions
Cookie Settings
Cookies and similar technologies are used on this website for proper function of the website, for tracking performance analytics and for marketing purposes. We and some of our third-party providers may use cookie data for various purposes. Please review the cookie settings below and choose your preference.
Strictly Necessary: Used for the proper function of the website
Performance/Analytics: Used for monitoring website traffic and interactions
Pull Scheduling/Planning. Visualization tools/management. Work Structuring and Scheduling. Prefabrication and Modularization. Standardization. Target Value Design (TVD). Teamwork and partnering. Total Production/Preventive Maintenance (TPM). Total Quality Management (TQM). Value Based Management/Value Streaming Mapping.
For teams to extract value from data, they must first make sense of the information they have—which is where data visualization comes in. Construction projects involve massive amounts of information and documents, including BIM models, schedules, budgets, and performance reports. And it’s not just about speed.
How to General Contractors help a project Owner Visualize the Project’s Percentage of Completion? I’ve seen many spreadsheets, reports, thousands of photos and AIA Schedule of Values all attempting to convey to the owner just how far along their project is. The problem is most owners need visuals.
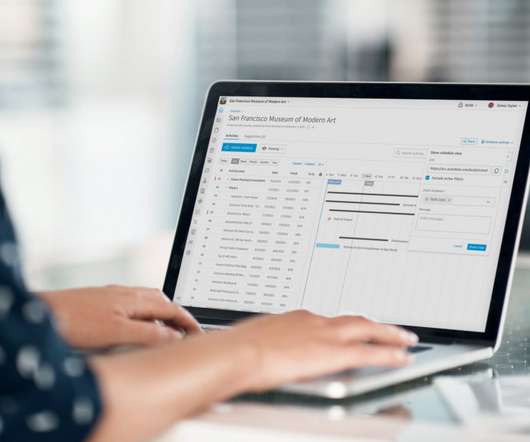
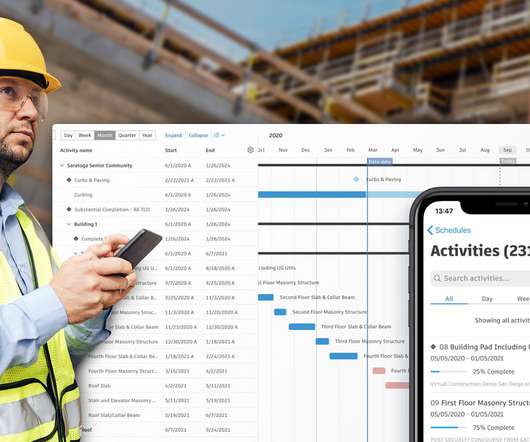
Construction schedules: they are highly complex, sometimes consisting of thousands and thousands of scheduled activities. This leaves you, the scheduler, to deal with tracking all the moving pieces to ensure projects stay on time and within budget. . But First, What is the Schedule Tool in Autodesk Build? .
Using a 3D model to visualize what’s happening on the project provides the most value, as it’s much easier to digest for non-specialists. Provided owners better visualizations and transparent project details to remove any doubt and enable faster decision-making. The result? Juneau boasts over 85% repeat business.
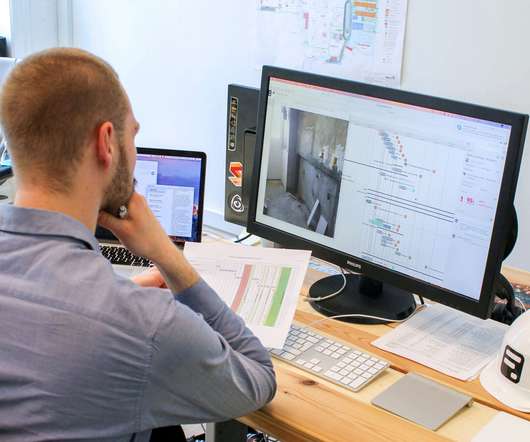
This is why having an accurate and updated project schedule is so important. When everyone has access to the construction schedule, the chances of completing the project on time and within budget are much higher. Unfortunately, most construction pros struggle to stay on top of project schedules.
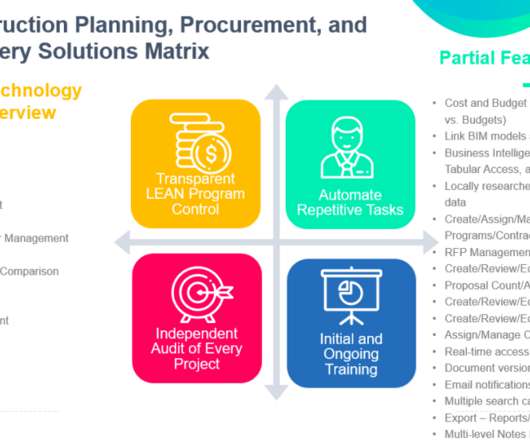
The innovate and exclusive Collaborative LEAN Construction Software for the Enterprise or Single Organization offering all of these features. The innovate and exclusive Collaborative LEAN Construction Software for the Enterprise or Single Organization offering all of these features.
Architectural Visualization with Alex Hogrefe. Do you have architectural visualization skills? Well, you are in luck because this episode is dedicated to discussing all things related to architectural visualization and graphics. . The Difference between “visualization” and “rendering” jump to 2:24 . jump to 5:04.
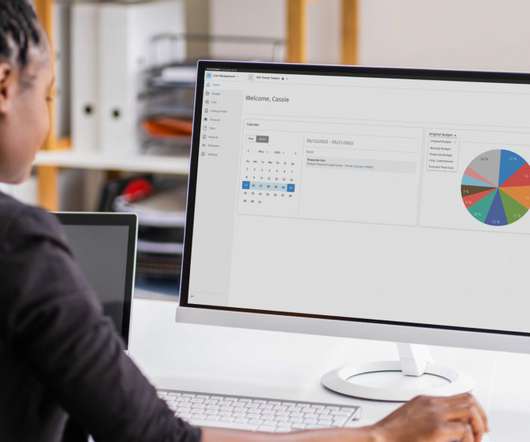
The challenge is achieving an integrated solution with estimating, scheduling and project management capabilities while addressing detailed job costing. There’s even handy charts to visually see your construction project’s financial health.
The review period is scheduled to end on 31. Participate in this last public review cycle before IFC4 final release and to submit any issues and recommendations for. improvement using the IFC4 Review Issue database at [link]. October 2012. Thereafter IFC4 final will be completed.
There are at least 3 “foundational” elements to an excellent website, along with many best practices including highly visual, mobile and responsive, and search engine optimized. And implement an active social posting program using scheduling tools like Hootsuite. Visuals/Examples/Testimonials. Mobile/Responsive.
LinkedIn Events lets you connect with others who will be there and you’ll be able to get a visual of people you want to meet. Dinner may be a tough sell due to scheduling or exhaustion from a long day. For B2B and construction companies, event Twitter hashtags are great way to let your network know where you’ll be and why.
The reports are consumed from the project dashboard which provides additional reporting for schedule risk as well as providing access to project information and tools. Visualized Data for Faster Decision Making. Operational reporting isn’t about using historical data for decision making on current projects.
Improve Your Construction Schedule. Today, there exist many technology platforms and tools that are designed to streamline construction project scheduling without necessitating that you create new workflows from scratch. Choosing a Construction Scheduling Tool. Better overview of clashes. Nor is one tool necessarily enough.
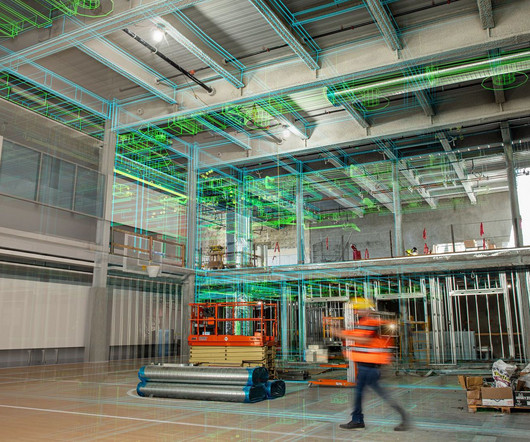
Schedule overruns come with the territory in construction, and this is often due to teams relying on manual processes, diminishing productivity, and exposing the project to unnecessary risk. You’ll also save time and drastically increase project scope visualization by instantly accessing quantities from the 3D model. .
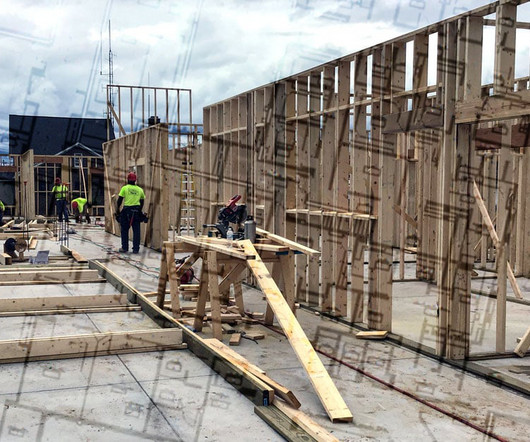
The first part is a visual inspection by the clerk of works or equivalent. If these levels are satisfactory and the clerk has completed the visual checks then the pour will proceed. Pre-Concrete Checks for Reinforcement: The pre-concrete check for reinforcement essentially comes in two parts.
Progress — Data visualizations communicate urgency to direct team members to help keep projects on schedule. Operations dashboards — Curated action items are sortable and filterable. Those assigned to multiple projects get cross-project data and can drill down into project level dashboards.
We’re all so mobile that unless we can all work together on our own schedules and collaborate effectively we’re doomed to failure. This crosses all workforce generations and makes a visual record that’s easy to learn, review, share and save to your project document repository. Conversations are Team Meetings.
Our schematic plan offers enough information to visualize the placement of the building on the chosen property, the layout of rooms, and verification that the plan will work within municipal requirements. We also gain all permit approvals, get materials ordered, and trade contractors scheduled for construction to commence at this time.
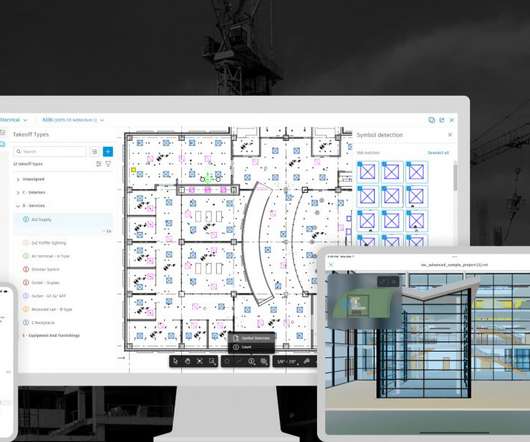
Barry showed the audience 5d takeoff tools available today, & Zach Goepel of Procore demonstrated how Artificial and Augmented Reality are providing visualization tools impossible a few short years ago, resulting in accelerated scheduling with reduced change orders.
In simple words, a project schedule is a kind of document that gathers all the important works so that project can be delivered on time. Besides that, it also provides automated email alerts so that team members can be aware about their scheduled tasks’ time and manager will know when someone’s availability has changed.
With such long time-tables, it’s difficult to plan for unforeseen schedule disruptions while managing the many moving parts of a project. Arguably the toughest part of a project manager’s job is managing the impact of those schedule disruptions across several teams working on the same project. . Key features of new Schedule Tool .
Now, project managers can visualize 3D models generated in Metaroom directly into Autodesk Build Insights or BIM 360 Project Home dashboards. Now, project stakeholders can visualize insights from DataSeer directly within Autodesk Build Insight or BIM 360 Project Home dashboards.
With construction design software, you can visualize different design possibilities, create professional presentations, better assess risks , and make more informed decisions. The software does offer a decent amount of customization along with 3D visualization, sketching, and rendering tools.
These components include schedule, cost, operations, and more. Essentially, 3D BIM lets you create and visualize the building's design. Scheduling 4D BIM adds the dimension of time to the 3D BIM model. This BIM dimension helps you plan, schedule, and optimize maintenance tasks throughout the building's lifecycle.
You can use a value stream map to visualize your flow of resources, create value for your customer, and eliminate waste during the process. Embrace pull planning and scheduling. Define what you need to deliver true value to your customer: information, equipment, labor, and materials. Then, remove any wasteful or unnecessary steps.
From enhancing quality and safety to improving critical schedule and cost workflows, dig into all the latest product releases and enhancements for Autodesk Build. . Cost Management | Contract Schedule of Values Full Screen* . Schedule . Schedule | Sort/Group activities in Web . Jump to releases by type: .
processes that keep technology off the critical path during construction and enable technology decisions to be made on a pull schedule. Introductory and ongoing training is a mandatory component and helps to support an environment where processes and outcomes are predictable.
Your plan also includes various types of inspections, visual and other, with multiple items/units of detail/measure… paint condition, chalking, water/gas leaks, window casings, concrete cracking, etc. Schedule Work Order (Fix Needed = Something is amiss, and should be scheduled for repair based upon established criteria).
This “look-around” feature brings a more dynamic and visual approach to modeling. . Schedule | Add References in iOS . Users can now link references to schedule activities in iOS such as Photos, Files, Sheets, Assets, and Issues to provide the necessary context into what can impact the schedule. .
A pay application form works closely with the schedule of values. A schedule of values : The schedule of values, or SOV, is a list of every work item on a construction job, along with each item’s cost. These documents include: The payment application form : See “Common Types of Pay Application Forms” below.
BIM, in addition to the 3D visualization, can manage the dimensions of time, cost, maintenance management and sustainability. Scheduled mainenance. BiC-6D allows you to manage all schedule normal and preventive maintenance activities to maintain asset value. Would you like more information on BiC -6D? Contact us!
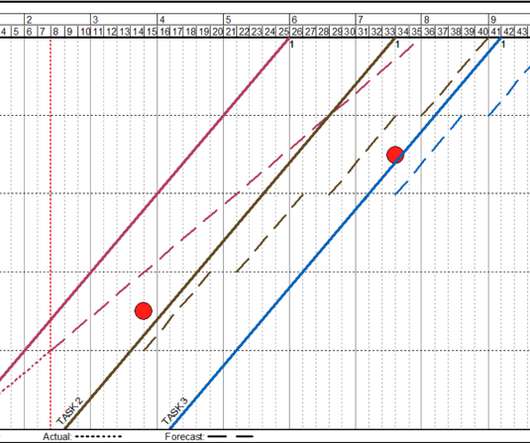
System (LBMS) builds on decades of work on location-based scheduling methods. The first recorded utilization of location-based methods in vertical construction was in the Empire State Building. More systematic approaches followed. Line-of-Balance was based on optimizing production of identical locations.
You keep the workflow on schedule from planning to handover. Keep everyone on the same page When you can effectively communicate plans and collaborate on a master schedule, you can reduce the risk of inefficiencies, conflicts, and defects. You ensure everything runs seamlessly.
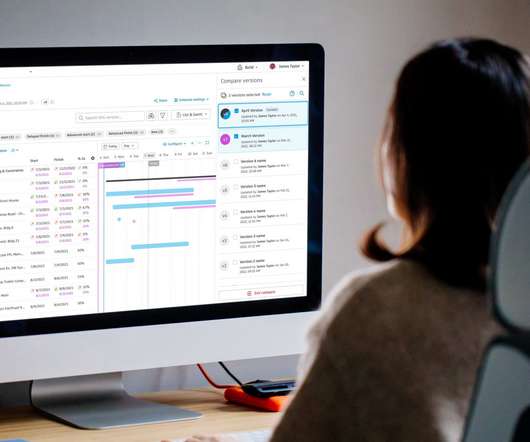
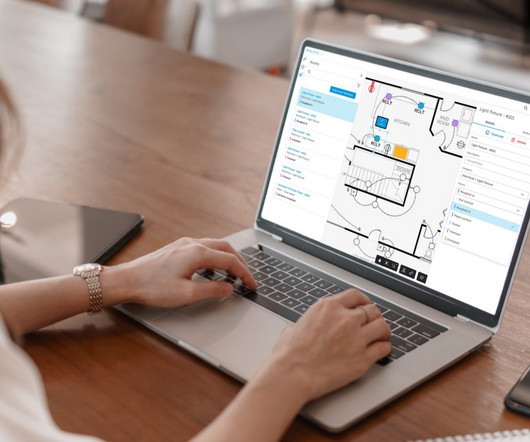
While project schedules are helpful, they’re often static and don’t contain real-time info on a project. With these new capabilities, you can visually markup 2D sheets and track asset progress to keep office teams updated while empowering folks in the field to forecast their productivity and quickly adjust to scheduling changes.
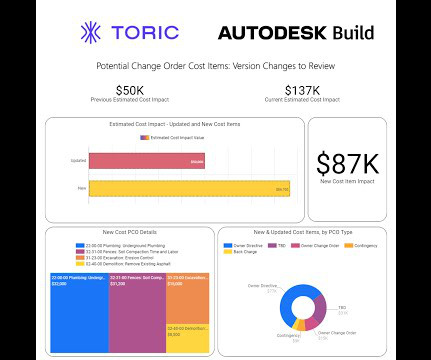
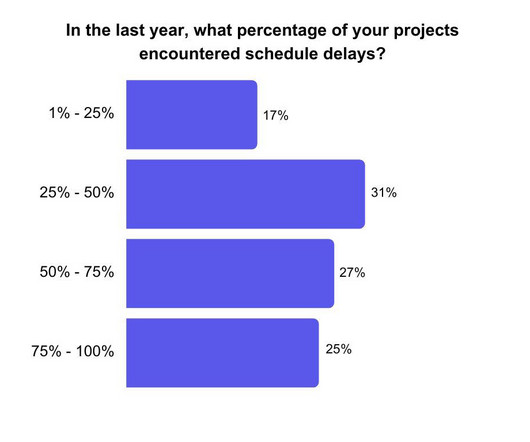
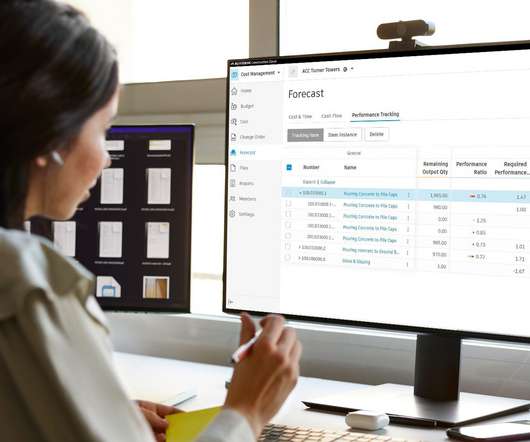
The information teams need to visualize the potential risk of schedule delays, and cost overruns – like productivity and budget data – isn’t always avai la ble at their fingertips. Enhance risk visualization. Performance Tracking uses visual indications and colors red and green to make it easy to identify areas of risk quickly.
Get BIM model and data in the hands of the field Use Autodesk Construction Cloud mobile app to interact with 2D design files and 3D models , take accurate measurements, and review BIM dat a such as project costs, installation materials, schedules, and more.
This allows project leaders to drill down and visualize analytics for specific projects as well as compile portfolio views for custom groups of projects, whether that is by region or project type, so that they can easily see only relevant dashboard views. . Schedule | Sort/Group activities in Web .
Visual enhancement to payment application document templates. Desktop connector schedule update improvement . Schedule | Desktop connector schedule update improvement – Schedule users with either manage or update permissions can now use the desktop connector to update schedules from Microsoft Project or Asta Powerproject. .
Topics included AI for construction scheduling, regenerative design, the micro-buildings movement, post-occupancy evaluation, predictive visual data analytics, and digital fabrication. . The event featured 19 talks from 25 AEC visionaries on topics related to the changing built environment and the future of the AEC industry.
We organize all of the trending information in your field so you don't have to. Join 116,000+ users and stay up to date on the latest articles your peers are reading.
You know about us, now we want to get to know you!
Let's personalize your content
Let's get even more personalized
We recognize your account from another site in our network, please click 'Send Email' below to continue with verifying your account and setting a password.


Let's personalize your content